Oltre a consentire la creazione e la gestione di campagne di influencer marketing, Buzzoole fornisce un potente strumento di analisi per blogger, instagramer, youtuber e in generale per tutti i Content Creator che già producono contenuti di successo in rete o vogliono migliorare la loro visibilità.
Dal suo lancio, ormai 4 anni fa, la tecnologia alla base di Buzzoole ha fatto molti passi in avanti, fino all’arrivo di GAIIA, il sistema di intelligenza artificiale sviluppato dal nostro team di Research & Development, in grado di fornire un’analisi ancora più accurata del livello di influenza dei Content Creator iscritti in piattaforma.
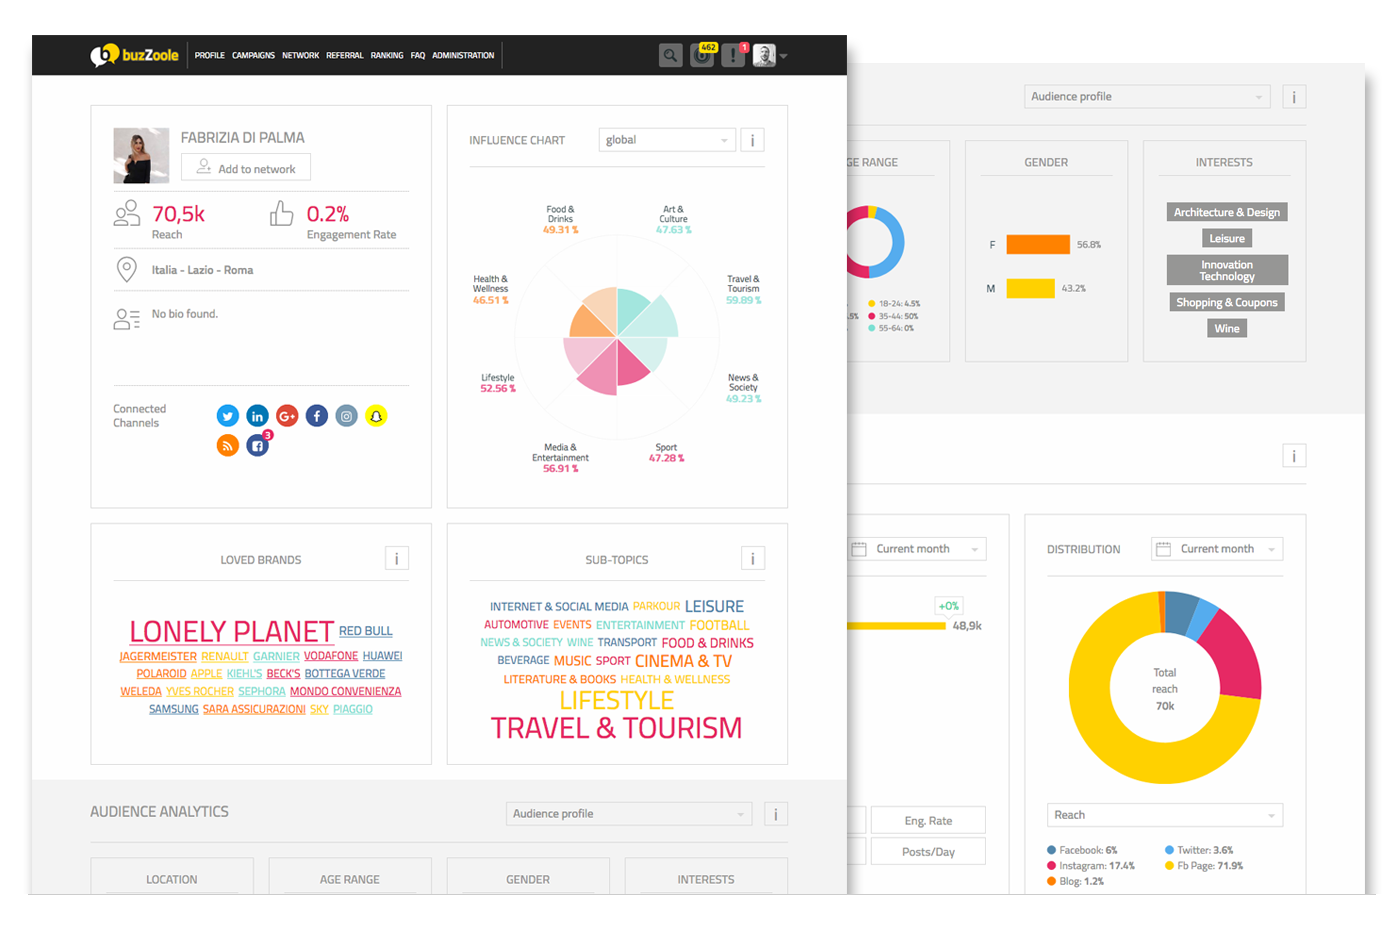
Da questo lavoro di ricerca è nata la nuova Dashboard Utente che i Creator visualizzeranno da oggi al loro ingresso in Buzzoole. Ecco quali sono le sue caratteristiche.
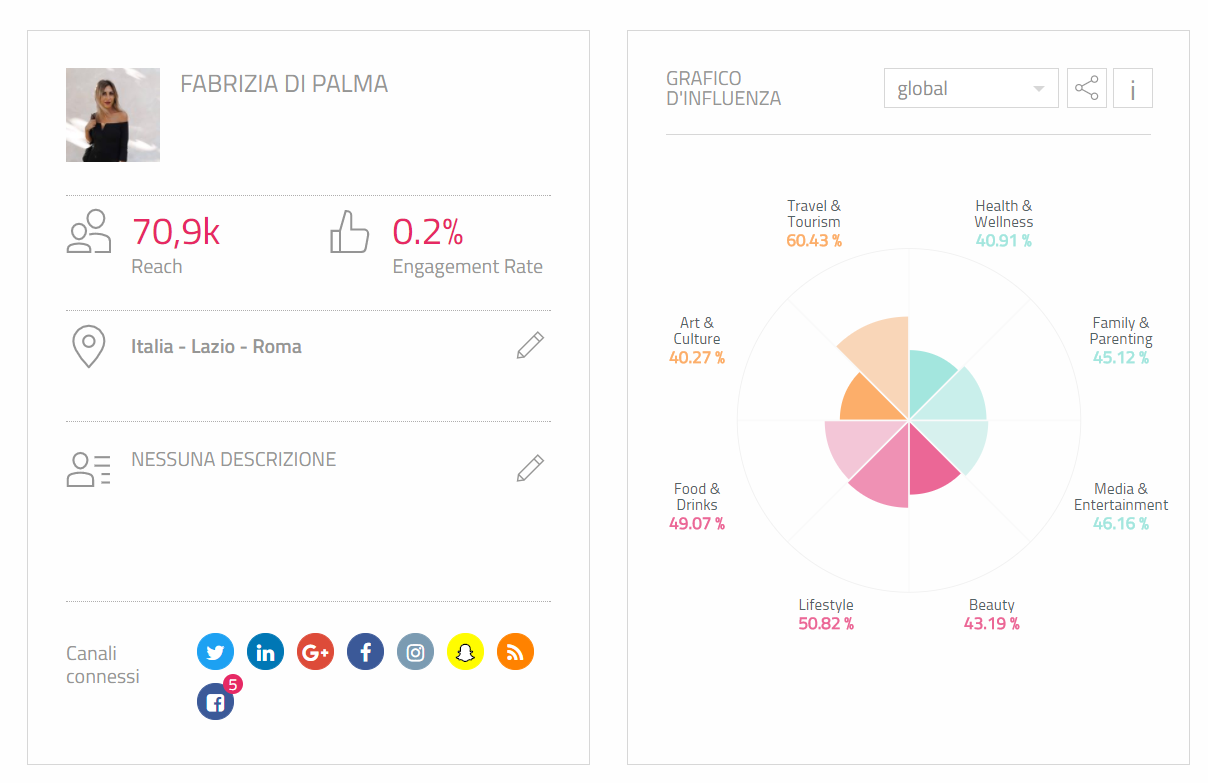
Panoramica della tua influenza: Overview & Grafico di Influenza
Una volta loggato sul tuo profilo avrai subito a disposizione una panoramica dei tuoi KPI più rilevanti: reach totale, tasso di engagement, geolocalizzazione, canali connessi.
Il Grafico di influenza mostra le 8 macro-categorie in cui sei più influente. Le percentuali rappresentate nel grafico sono calcolate sulla base di un benchmark realizzato analizzando tutti i profili presenti in piattaforma. I dati possono essere visualizzati in maniera aggregata (per tutti i canali collegati) oppure divisi per canali attraverso la selezione dal menu a tendina.
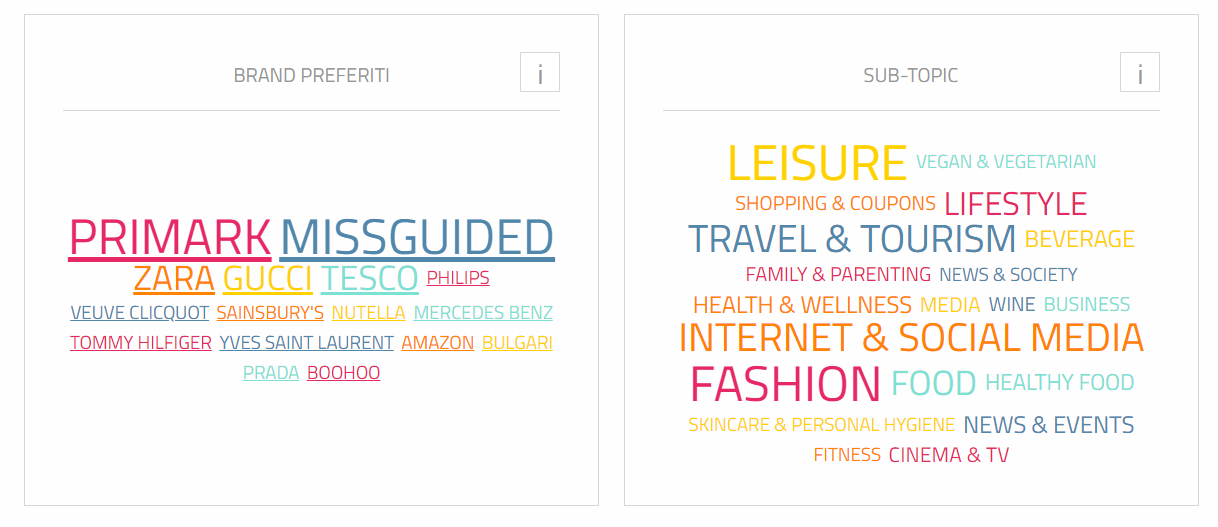
In cosa sei influente? Brand preferiti & Sub-topic
I Brand preferiti sono quelli che vengono menzionati più spesso in maniera positiva dai Content Creator. Non si tratta di un dato quantitativo, ma qualitativo ottenuto grazie all’analisi del sentiment delle menzioni associate ai Brand.
Sub-topic
La cloud dei Sub-topic rende visibili gli argomenti più trattati dai Content Creator su tutti i loro canali.
Pro tip: questo dato può esserti molto utile per orientare e bilanciare il tuo piano editoriale.
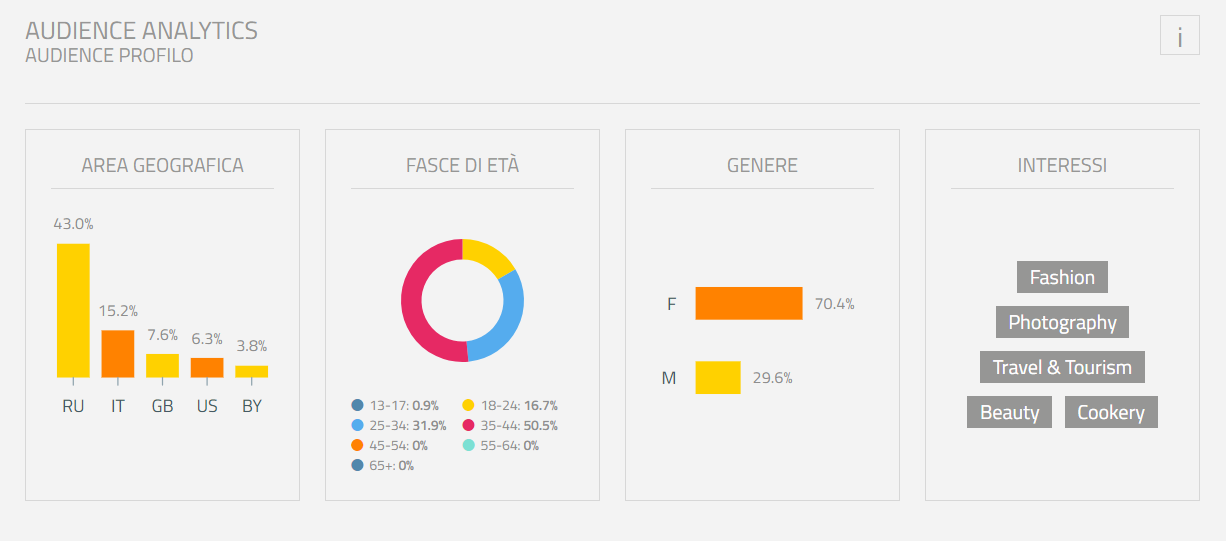
Audience Analytics
In questa sezione troviamo l’analisi dell’audience, visualizzabile sia come dato aggregato sia divisa per canali. Nello specifico è possibile analizzare: la provenienza geografica, le fasce di età, il genere e gli interessi del tuo pubblico. Quest’ultimo dato si basa sulle interazioni che gli utenti effettuano realmente con i tuoi contenuti.
Pro tip: usa questi dati per capire lo stile e i topic da affrontare nei tuoi contenuti. La tua audience va dai 18 ai 24 anni? Utilizza uno stile fresco e informale e focalizza i tuoi contenuti sulle ultime tendenze della tua nicchia di riferimento.
Monitora le tue performance online: Performance Analytics & Trend canali

Quest’area illustra le performance dei canali nel periodo di tempo selezionato (1 mese, 2 mesi, ecc.). In particolare è possibile analizzare la crescita della reach, dell’engagement rate, dell’engagement per post, l’engagement totale e il numero di pubblicazioni al giorno.
Il Grafico di distribuzione mostra nel dettaglio la suddivisione dei canali per uno dei KPI appena citati.
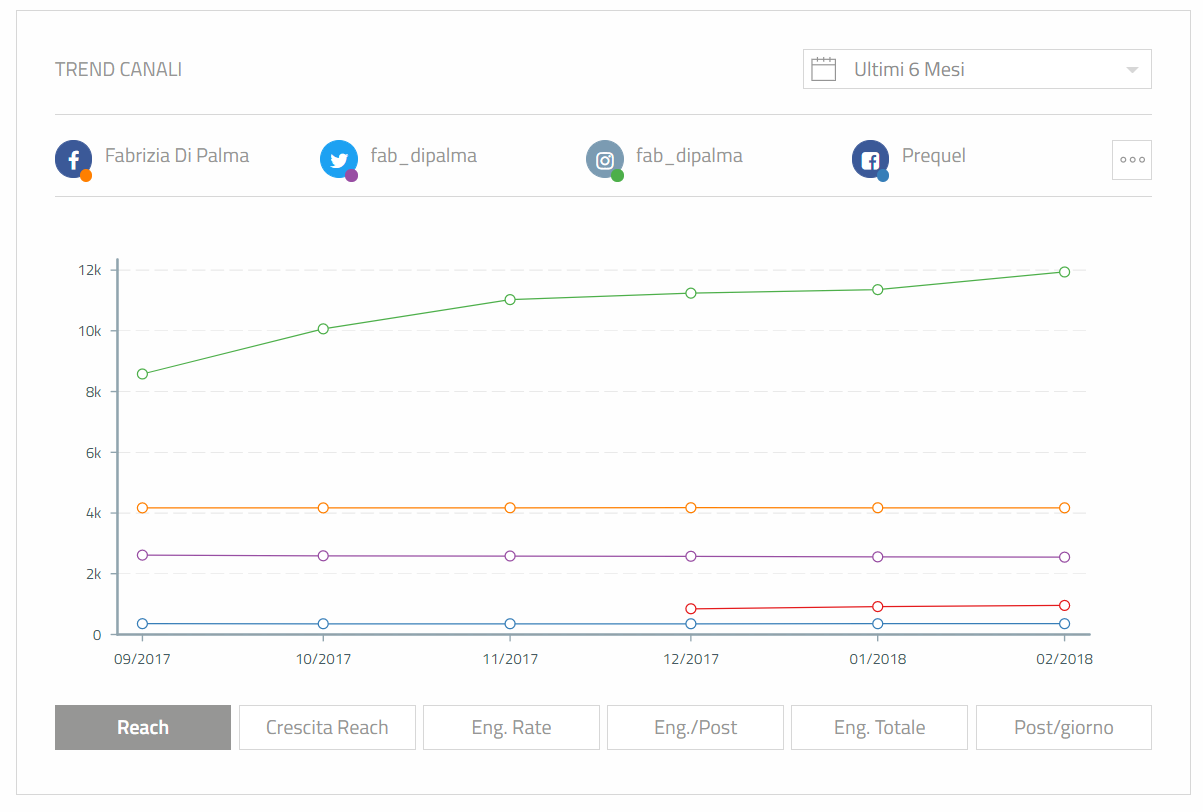
Trend Canali
Questo grafico aiuta ad avere una panoramica più chiara delle performance dei canali nel corso del tempo.
Pro tip: vedi quali sono i momenti in cui i tuoi canali hanno performato meglio e risali ai contenuti pubblicati in quell’arco di tempo. Questo ti indicherà la strada da prendere per i tuoi prossimi contenuti.
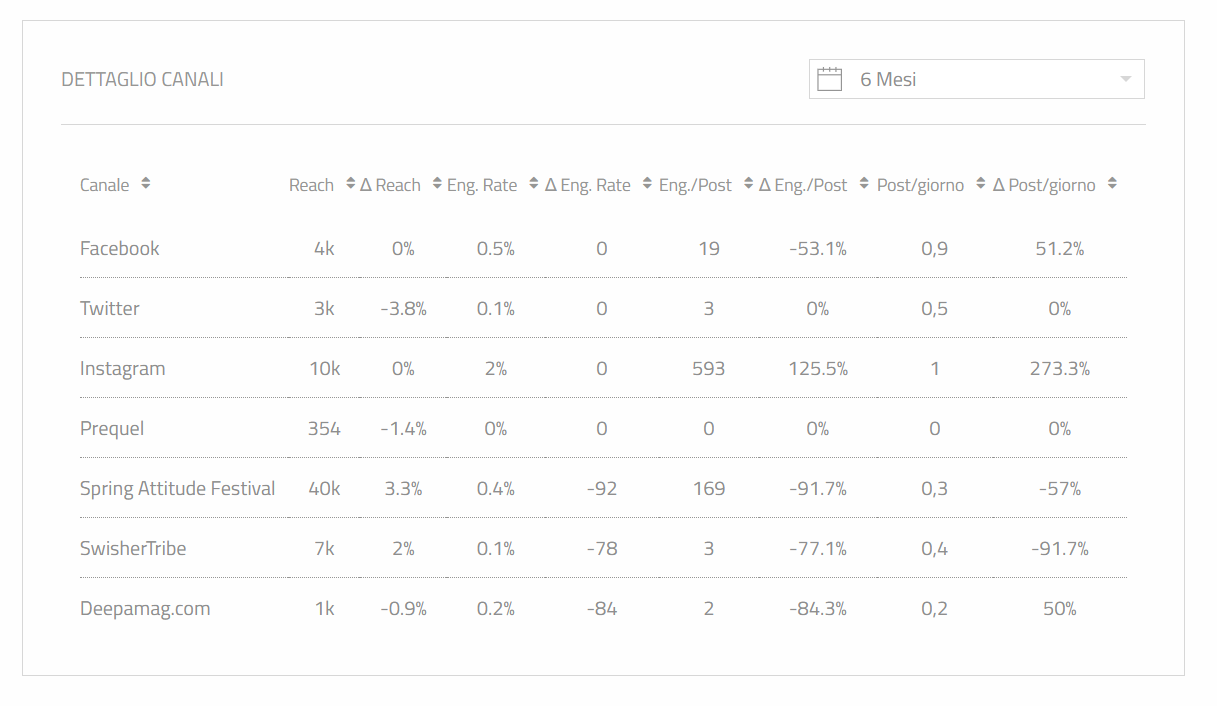
Dettaglio canali
Il dettaglio canali mostra la variazione di crescita dei singoli canali per ogni parametro e in un arco temporale definito.
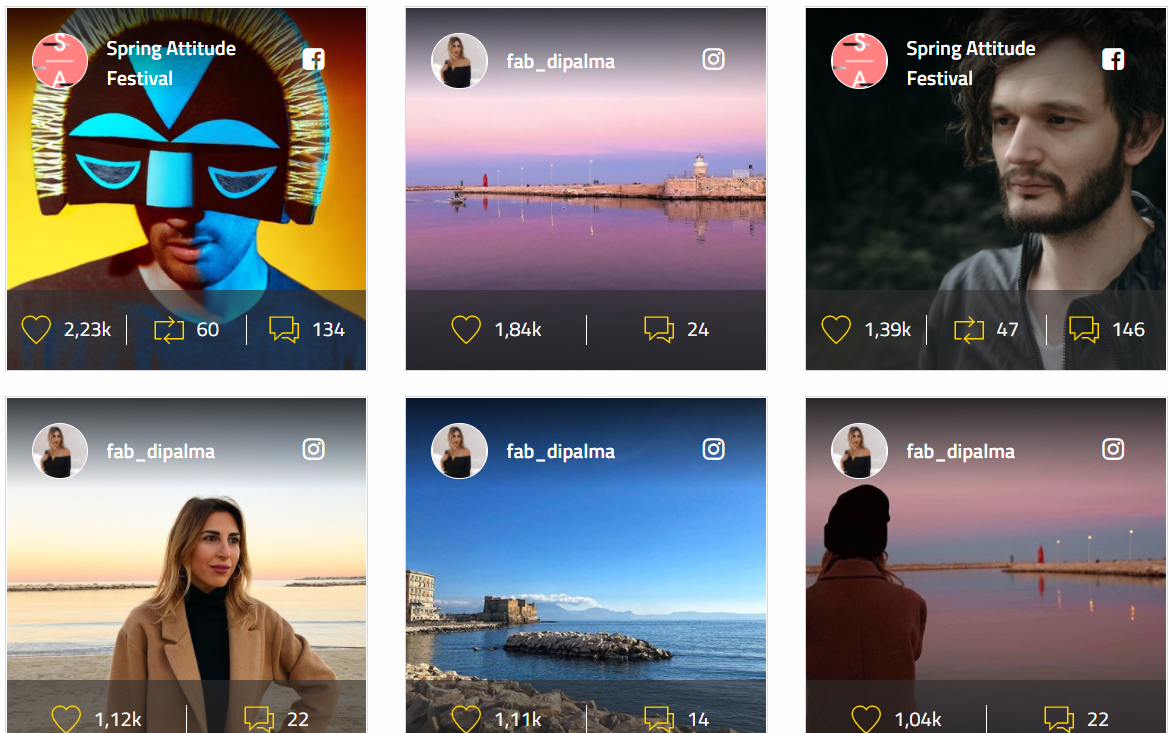
Contenuti con maggiore engagement
Infine, ecco una panoramica visiva dei post che hanno generato il maggior numero di interazioni tra il tuo pubblico.
Pro tip: Funzionano meglio i tuoi selfie, le foto dei tramonti o i tuoi post brandizzati? Scoprilo a colpo d’occhio in questa panoramica visual dei tuoi migliori contenuti.
Come hai visto, la Dashboard personale si è trasformata in uno strumento di analisi molto potente e assolutamente gratuito disponibile per tutti gli utenti che si iscrivono a Buzzoole. Attraverso questa feature arricchita di nuove funzionalità, potrai non solo gestire le tue impostazioni personali e le tue campagne, ma avere una panoramica chiara delle tue performance online e capire quali sono i tuoi punti di forza e cosa puoi invece migliorare.
Come sempre, nel rispetto della tua privacy, i nuovi insight della tua Dashboard personale sono visibili solo a te e ai brand con i quali deciderai di collaborare.
Collegati con uno dei tuoi canali social preferiti e scopri subito quanto sei influente!